This is our old blog. It hasn't been active since 2011. Please see the link above for our current blog or click the logo above to see all of the great data and content on this site.

Archive for the 'Gamelogs' Category

Dunn’s streak is…umm…dunn.

5th October 2009

I have to admit that I really thought Adam Dunn was going to hit 40 HR again this season after having done that each of the 4 previous seasons. He hit his 38th homer in the Nationals' 150th game this season, and then played 10 more games this season through yesterday's finale. Dunn ended up going hitless in 8 out of those 10 games and homerless in all 10.

Still, Dunn had a great season. His 142 OPS+ was the second-highest of his career, as were his 105 RBI, and his BA, OBP, and SLG were all above his career averages.

Posted in Gamelogs | Comments Off on Dunn’s streak is…umm…dunn.

Feature Watch: Player Pitching Gamelogs

2nd October 2009

Today, I thought it would be a good idea to follow up on Monday's post about individual batting gamelogs with a few words about our gamelogs for individual pitchers.

Pitching gamelogs boast the same row-summing features and career/season-to-date red text tooltips as their batting counterparts, of course, and the amount of data we show for each of the pitcher's games is really going to help you know everything you need to about his performance. We have the standard box score line -- Dec, IP, H, BB, K, ER, etc. -- but we also show how many days of rest he pitched on, how many batters he faced, his pitch count (along with detailed numbers on his strikes and batted balls allowed), SB/CS data, the opposing batting line, his Win Probability Added and the Leverage Index for his appearance, plus the circumstances under which he entered and exited the game. I should also point out that above the gamelog table, you can find the team's record in the pitcher's appearances/starts, and at the bottom of the page you will see a table containing his usage by days of rest, as well as a table showing the distribution of his run support over the season in question.

And if that wasn't enough, you can also click on various items in the logs to pull up even more in-depth information. By clicking on the pitcher's red text in the innings pitched column, you'll see an inning-by-inning breakdown of his outing, including hits and runs allowed, as well as batters faced, pitches, and strikes thrown. If you click the red tooltip under the "Entered" column, you'll see a box pop up with a graphical representation of the situation when he came in, including the men on base and the fielders behind him.

But perhaps the most mind-blowing feature is what happens when you click the link in the pitch count column. Go ahead, try it... The link will take you to BrooksBaseball.net's PitchFX Tool, which gives you an amazing assortment of tables and graphs culled from MLBAM's Pitchf/x system (you know, that thing with the cameras that tracks pitches). You can see velocities, inches of break, etc. from the game in question, courtesy of BrooksBaseball's pages, and all of it links up directly with our gamelogs to give you a very visible connection between the player's results (H, ER, BB, K) and the pitches that led to those results. (Note: Currently, this feature is only available for the 2009 season.)

So go over and check out our pitching gamelogs, I know you'll get a lot of use out of them, especially with the playoffs on the horizon.

Posted in Gamelogs, Site Features, Tutorials | Comments Off on Feature Watch: Player Pitching Gamelogs

Feature Watch: Player Batting Gamelogs

28th September 2009

Today we're going to talk a little about the individual batting gamelogs, which are by no means new here at Baseball Reference, but at the same time are tools that I think we can continually stand to learn new things about. To access a batter's gamelogs, go to his main page, point to "Game Logs [+]" under the "Standard Batting" table, and select the logs you want to look at.

Read the rest of this entry »

Posted in Gamelogs, Site Features, Tutorials | Comments Off on Feature Watch: Player Batting Gamelogs

Postseason Gamelogs

25th September 2009

Babe Ruth Postseason Batting Gamelogs and Postseason Pitching Gamelogs

They went missing when we redesigned the site, but I just got them updated and back on the. If you look at the gamelog drop down on the player pages, there is now a postseason option (where relevant) along with the years and if you look at the postseason sections on the player pages you will see links to Postseason Gamelogs. Enjoy.

Posted in Gamelogs, Site Features, Uncategorized | 1 Comment »

Innings with 3 Sacrifice Flies

6th August 2009

I have recently discovered the joy of reading old Baseball Digest articles by Rich Marazzi regarding anomalies during past baseball seasons. In his review of the 2000 season Marazzi makes mention of how the Yankees  had 3 sacrifice flies in an inning twice during that season. This impossible sounding feat can occur when an error is made on a fly ball and the official scorer rules that the runner on third would have scored, thereby awarding a batter a sacrifice fly even though he didn't make out. Although we can't easily research this using PI (until there is an batting inning  finder), The Baseball Almanac lists the four times in baseball history that this has happened and I thought it might be interesting to look at the play descriptions from these games.

Read the rest of this entry »

Posted in Gamelogs | 8 Comments »

Missed Games in Batting Gamelogs

10th July 2009

Manny Ramirez 2009 Batting Gamelogs - Baseball-Reference.com

For now this is just for 2009. I've added a note to the Gtm column (Team Game number), that shows cases where the batter missed a series of team games. This is a little funky for pitchers, but for batters it shows the number of games missed between the game in that row and the previous game. I don't show this at the end of the year or when a player switches teams because that is too hard to calculate and this took about 15 minutes to implement. Hmm, why did Manny have that 50 game gap?

A writer for the NY Daily News (which will have a profile of B-R this Sunday) gave me the idea.

Posted in Announcements, Gamelogs, Media Mentions | 6 Comments »

Joe Mauer is not going to hit .400

9th July 2009

Let me start by saying that I like Joe Mauer as much as the next guy. He's the best-hitting catcher in the game and might be the best hitter (period) in the game.

Right now, Mauer's hitting .388 and there's tons of excitement that he might hit .400 for the year. It ain't gonna happen.

First, go check out Sean's post from last year about longest runs to .400. This shows you the deepest into the season players have gotten with a .400 batting average. Mauer's got 224 AB right now and there are 13 guys on that list who went more ABs while maintaining a .400 average. Keep in mind that Mauer's already below .400. Don't even get excited unless he gets to about 275 AB and has raised his average to .400.

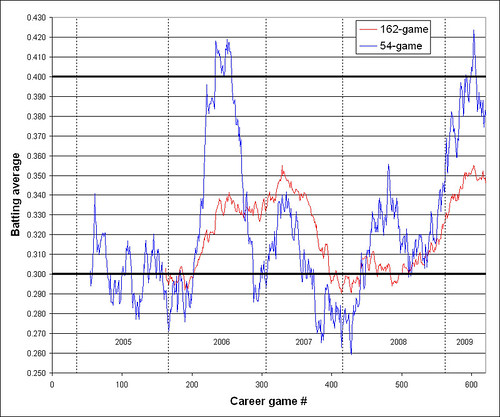
Let's take a deeper look at Mauer's career. Here's a plot showing his rolling batting average over each 162-game period of his career.

Click on image for larger version

Click on image for larger version

The red line shows his average over each 162-game period and you can see that he's twice peaked at about .355, including once in early 2007 and once about 2 weeks ago. Notice that while .355 is a fantastic batting average, it's a lot less than .400.

The blue line shows Mauer's batting average over a rolling 54-game window (that's a third of a season.) In this case, he hit a peak of .423 again about 2 weeks ago. While this is impressive, many players have done it over the last 50 years, and none of them have gone on to hit .400 for a season.

Two arguments that do help Mauer's case is that Tony Gwynn did hit .400 over a 162-game period from 1993 to 1995 as well as the fact that Mauer doesn't need to do it over 162 games. He's qualified for the batting title right now, despite having played in only 60 out of Minnesota's 85 games so far this season. At that pace, he needs to hit .400 over only about 115 games. I re-ran my above analysis using a rolling 115-game window and Mauer's peak was .368 coming at that same point about 2 weeks ago. Very nice, yes. Close to .400? Not so much.

By the way, I generated the graph by copying all of Mauer's game logs into Excel and then culling out the hits and AB data.

Posted in Gamelogs | 5 Comments »

Gamelogs with Pitch Detail

23rd June 2009

Josh Beckett 2009 Pitching Gamelogs - Baseball-Reference.com

If you look at the 2009 (and eventually the 2008) pitching gamelogs you will see that the pitch count columns are now links. Clicking there will take you to the BrooksBaseball.Net summary page for that game where you can see things like velocity, location, and much much more in graphical and text formats. I am working with Dan Brooks on a couple of projects and this is the first step in bringing some of this pitch information to the site. Hope you enjoy it.

Posted in Announcements, Gamelogs, Pitcher vs. Batter | 4 Comments »

Fast Start to a Young Career

3rd May 2009

In honor of the Celtics victory over the Bulls, here is a search that I came across a few weeks ago:

Most games with a hit in a player's first 30 career game age 20 or younger (since 1954):

                   Games Link to Individual Games
 -----------------+-----+-------------------------
 Roberto Clemente     26 Ind. Games
 Garry Templeton      24 Ind. Games
 Rickey Henderson     24 Ind. Games
 Thad Bosley          24 Ind. Games
 Jay Johnstone        23 Ind. Games
 Danny Ainge          23 Ind. Games
 Chris Speier         22 Ind. Games
 Ron Santo            22 Ind. Games
 Ivan Rodriguez       22 Ind. Games
 Aurelio Rodriguez    22 Ind. Games

Check out the guy at #6.

Ainge was 0-4 in his 30th game so here are his totals through his first 29 games:

Danny Ainge Batting Gamelogs for Career Games 1 to 29

Date Tm G GS Rslt PA AB R H 2B 3B HR RBI BB IBB SO HBP SH SF ROE GDP SB CS BA OBP SLG OPS
May 21, 1979 to Jun 20, 1979 TOR 29 29 13-16 114 107 13 33 4 1 1 10 4 0 17 1 2 0 0 3 1 0 .308 .339 .393 .732
per 162 games 162 162 637 598 73 184 22 6 6 56 22 0 95 6 11 0 0 17 6 0

His secondary numbers were not very good, but considering that he was 20 years old and playing second base, he had a pretty good run. If you're interested, here are Ainge's (baseball) career numbers  after his 29th game.

Posted in Gamelogs, Leaders | 3 Comments »

Pitch’ Counts, Of Another Nature

11th January 2008

Via Baseball-Reference.com's Play Index Team Pitching Gamelog Finder - Most wins by teams in 2007 where they used 4 pitchers or less in the game.

 Tm  Year Games Link to Individual Games 
 +---+----+-----+-------------------------+ 
 LAA 2007    82 Ind. Games 
 CLE 2007    81 Ind. Games 
 BOS 2007    76 Ind. Games 
 TOR 2007    69 Ind. Games 
 NYY 2007    66 Ind. Games 
 NYM 2007    66 Ind. Games 
 CHC 2007    64 Ind. Games 
 ARI 2007    63 Ind. Games 
 SEA 2007    61 Ind. Games 
 SDP 2007    61 Ind. Games 
 DET 2007    61 Ind. Games 
 PHI 2007    60 Ind. Games 
 LAD 2007    60 Ind. Games 
 MIN 2007    59 Ind. Games 
 COL 2007    58 Ind. Games 
 OAK 2007    57 Ind. Games 
 MIL 2007    54 Ind. Games 
 ATL 2007    53 Ind. Games                   
 HOU 2007    49 Ind. Games 
 CHW 2007    48 Ind. Games 
 STL 2007    47 Ind. Games 
 TEX 2007    46 Ind. Games 
 TBD 2007    46 Ind. Games 
 SFG 2007    46 Ind. Games 
 CIN 2007    46 Ind. Games 
 KCR 2007    45 Ind. Games 
 BAL 2007    43 Ind. Games 
 PIT 2007    42 Ind. Games 
 WSN 2007    34 Ind. Games 
 FLA 2007    30 Ind. Games

And, on the flip-side, here's the most wins by a team, last year, in games where they used 5 pitchers or more:

 Tm  Year Games Link to Individual Games 
+---+----+-----+-------------------------+ 
 FLA 2007    41 Ind. Games 
 WSN 2007    39 Ind. Games 
 COL 2007    32 Ind. Games 
 STL 2007    31 Ind. Games 
 ATL 2007    31 Ind. Games 
 TEX 2007    29 Ind. Games 
 PHI 2007    29 Ind. Games 
 MIL 2007    29 Ind. Games 
 SDP 2007    28 Ind. Games 
 NYY 2007    28 Ind. Games 
 SEA 2007    27 Ind. Games 
 DET 2007    27 Ind. Games 
 ARI 2007    27 Ind. Games 
 PIT 2007    26 Ind. Games 
 CIN 2007    26 Ind. Games 
 BAL 2007    26 Ind. Games 
 SFG 2007    25 Ind. Games 
 KCR 2007    24 Ind. Games 
 HOU 2007    24 Ind. Games 
 CHW 2007    24 Ind. Games 
 NYM 2007    22 Ind. Games 
 LAD 2007    22 Ind. Games 
 CHC 2007    21 Ind. Games 
 TBD 2007    20 Ind. Games 
 MIN 2007    20 Ind. Games 
 BOS 2007    20 Ind. Games 
 OAK 2007    19 Ind. Games 
 CLE 2007    15 Ind. Games 
 TOR 2007    14 Ind. Games 
 LAA 2007    12 Ind. Games

It's pretty clear that the Angels, Indians, Red Sox and Blue Jays got most of their wins in games where they used 4 pitchers or less.  And, it's pretty clear that the Marlins and Nationals got more of their wins in games where they used 5 pitchers or more.

Of course, this does not take into account each team's offense.

Still, it's an interesting slice of data. 

Take a team like the Red Sox - just because they're low on the second list doesn't mean they had a bad pen last year.  They're low on the second list because they're so high on the first list.

However, a team that's low on the first list and high on the second list may be there because they have a deep and effective pen. 

If anyone has some thoughts on the value that can be taken from lists like these, please do share them.  Thanks in advance.

Posted in Gamelogs | 2 Comments »