This is our old blog. It hasn't been active since 2011. Please see the link above for our current blog or click the logo above to see all of the great data and content on this site.

Archive for the 'Splits' Category

A-Rod vs Angels

24th April 2010

On the FOX telecast of the Yankees-Angels game, they just mentioned how A-Rod has 70 HR against the Angels.

Here are his split against all teams, minimum 30 games (thus eliminating most NL teams):

I Split G GS PA AB R H 2B 3B HR RBI BB SO BA OBP SLG OPS tOPS+
Los Angeles Angels of Anaheim 176 175 792 683 158 224 37 3 67 154 81 159 .328 .405 .685 1.090 123
Baltimore Orioles 183 183 813 700 151 216 38 1 50 161 89 150 .309 .390 .580 .970 101
Boston Red Sox 193 190 848 730 143 206 35 2 43 121 95 163 .282 .375 .512 .887 85
Chicago White Sox 129 127 550 488 76 132 18 2 25 76 55 100 .270 .346 .469 .815 70
Cleveland Indians 111 110 497 429 74 127 28 1 28 87 57 93 .296 .383 .562 .944 96
Detroit Tigers 110 110 481 430 95 147 32 3 32 105 44 76 .342 .406 .653 1.060 118
Kansas City Royals 132 131 603 490 118 158 29 0 40 104 93 110 .322 .434 .627 1.061 120
Minnesota Twins 122 120 537 466 100 154 21 3 44 110 59 77 .330 .405 .672 1.077 120
New York Mets 37 37 169 140 27 45 4 0 10 30 26 21 .321 .426 .564 .990 107
New York Yankees 82 81 374 335 70 112 20 1 28 74 31 67 .334 .386 .651 1.037 112
Oakland Athletics 162 161 722 634 114 179 29 3 41 122 68 149 .282 .362 .532 .893 85
Seattle Mariners 105 102 455 379 81 107 16 3 31 80 60 72 .282 .391 .586 .977 102
Tampa Bay Rays 158 158 706 620 117 175 40 2 41 125 69 132 .282 .365 .552 .917 89
Texas Rangers 105 104 466 393 85 124 23 1 17 69 60 85 .316 .415 .509 .924 95
Toronto Blue Jays 177 177 785 674 140 207 41 0 50 149 91 150 .307 .400 .591 .991 105
Provided by Baseball-Reference.com: View Original Table
Generated 4/24/2010.

So, yeah, A-Rod has worn out the Angels with by far the most home runs and his highest OPS-against. Those numbers are pretty insane--in just a bit over a season's worth of games he has 67 HR and 154 RBI. Nice.

Incidentally, the discrepancy between what was said on TV (70 HR) and the numbers above (67 HR) are the 3 homers he hit in the ALCS against them last year.

By the way, I had no idea that Eric Karros had a lisp. He's a pretty good commentator--exactly what I like from former players. He's knowledgeable about hitting, the umpires, and the managers and he's sharing small relevant nuggets as the game moves along.

Posted in Splits | 2 Comments »

Are you worried about the right thing?

1st April 2010

As the season nears, it's always interesting to hear fans talk about their own teams. I hear lots of talk about hitting, such as whether the team can beat last year's home run total, and lots of talking about starting pitching and the closer. I almost never hear anybody talk about middle relief.

You might want to think a little more about your team's middle relief.

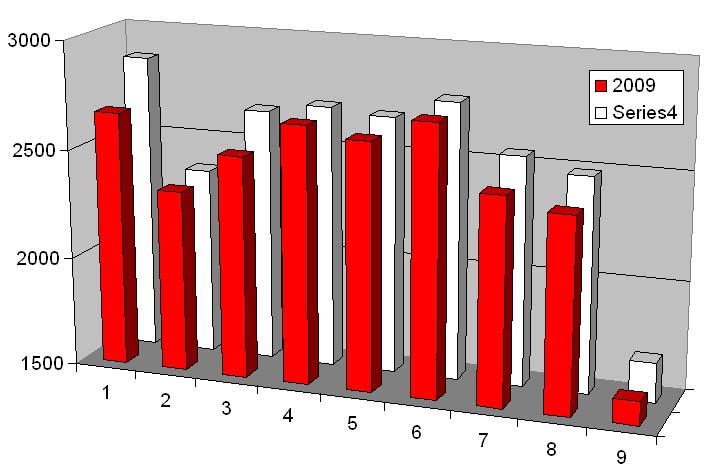
Check out the following plot showing number of runs scored by inning in MLB in both 2009 and the average over the years 2000-2009. This sort of data is available here.

Before I continue the discussion of middle relief, let me address some basic things about this plot:

  • Note that I scaled the y-axis to include only 1500 to 3000 runs.
  • The run scoring is always highest in the 1st inning, which makes sense since a team's best hitters always bat in the 1st.
  • The run scoring is always lowest in the 9th inning, although this is mainly an artifact. Teams that win at home (other than walk-off wins) don't bat in the 9th so the run total is artificially low. I bet if I looked at run scoring by just the visiting team, scoring would still be a little low in the 9th inning thanks to the occasional presence of the home team's closer, who is usually one of the best pitchers on the team.
  • After the 9th inning, the lowest-scoring inning is always the second inning (this is true in every individual season 2000 to 2009.) This is because most often, the lower part of the batting order comes up here. By the time we get to the 3rd inning, there is a lot of randomness in terms of which players are batting. Think about it this way--when does a team's leadoff hitter usually bat for the second time? If his team scored a couple runs in the first two innings, he'll probably bat in the second inning. If not, he'll usually bat in the third inning. if his team didn't get anybody on base at all, he won't bat until the 4th inning. So it's tough to predict who will bat when once you get past the first couple of innings.

Here's the entire point of this post: after the 1st inning, the inning that always has the most scoring is the 6th inning. That's true for every season 2000 to 2009. What are the reasons for this? There are three obvious ones I can think of:

  • Starters tire significantly by the 6th inning and performance starts to worsen
  • By the 6th teams are more likely to use a pinch hitter when a run-scoring chance presents itself, meaning a better hitter is likely to bat
  • Once the starter leaves, the guys who relieve in the 6th inning are the worst pitchers on the team.

Most readers are probably familiar with Bill James' argument that closers should not be saved for the 9th inning but rather should be used in key situations in the 6th through 8th inning, when many games are decided. Instead, most teams are trotting out guys with ERAs well over 4.00.

Here's a different angle that approaches this same issue: think of teams to win the World Series in the last 15-20 years. Chances are you can name some of their middle relievers. How about Duane Ward in 1992, Greg McMichael in 1995, Mike Stanton and Jeff Nelson in 1998, Brendan Donnelly in 2002, Mike Timlin in 2004, Neil Cotts in 2005, and lots of other guys.

The bottom line is this--teams with lousy relievers allow more runs when it counts. The difference isn't huge, but it's a real trend. The middle relief guys probably make the difference of 3-5 wins per year--doesn't sound like a lot, but it could be the difference between your team winning 87 games and going home and winning 92 games and going to the playoffs as the wild card.

So, are you worried about your team's middle relief?

Posted in Splits | 13 Comments »

10 for 10: #2 1920-39,52,53 RetroSheet Data, Improved Box Scores, Gamelogs, and Splits

19th March 2010

This is the second of ten features we are adding for our 10th anniversary.

Due to the tireless work of the RetroSheet volunteers (otherwise known as heroes) Baseball-Reference.com now has play-by-play (PBP) for the 1952 and 1953 seasons and box score level accounts (BSEF) of all games in the 1920-1939 seasons. This is the first time that I have incorporated seasons with just BSEF data, so it necessitated some changes which I'll try to highlight below.

Beyond that major change there have been many, many additional improvements to the
Read the rest of this entry »

Posted in 10 for 10, Announcements, Box Scores, Gamelogs, Site Features, Splits, Stats | 21 Comments »

Splits Tease 2: Pitchers by Run Support, Blyleven and Morris

16th March 2010

I'll soon be adding a split that shows how pitchers do when their teams score 0-2, 3-5, or 6+ runs in a game.

Here is a little taste.

Pitcher 0-2 runs 3-5 Runs 6+ runs
Jack Morris 143 G, 17-110 (.134), 6 SHO, 4.00 ERA 216 G, 98-66 (.598), 16 SHO, 3.56 ERA 190 G, 139-10 (.933), 6 SHO, 4.21 ERA
Bert Blyleven 232 G, 39-163 (.193), 22 SHO, 3.35 ERA 273 G, 119-81 (.595), 22 SHO, 3.27 ERA 187 G, 129-6 (.956), 16 SHO, 3.33 ERA

This is almost the perfect example of Simpson's Paradox. Blyleven was (very nearly) had the better winning percentage in each category of run support, but has the worse overall winning percentage due to the weighting of the various categories.

Rich Lederer feel free to use this.

Posted in Announcements, Splits, Stats | 13 Comments »

A Splits Tease

9th March 2010

I'm been getting the new RetroSheet data into our database and I'm working on. This is raw from the database, so the format and columns are a bit funky. This is Babe Ruth in 1927.

splitsplit_nameGABHRRBIBBSOBAOBPSLGOPS
half1st Half78280297673480.3610.4930.7541.246
half2nd Half73260318864410.3500.4780.7921.271
monthSept/Oct28106174320160.3680.4680.8961.364
monthMay28106123425180.3490.4730.7741.247
monthJune237691920160.3820.5100.8291.339
monthJuly3111193531140.4230.5490.7931.342
monthAugust269092723160.2560.4070.6561.063
monthApril/March1551461890.3330.5070.5881.095
lineuBatting 3rd15154060164137890.3560.4860.7721.258
hmvisHome73253287061420.3720.4940.7751.268
hmvisAway78287329476470.3410.4790.7701.249
siteWAS09114341210100.3490.4720.6511.123
siteSTL0711394121170.2820.4400.6921.132
sitePHI111145513870.2890.3960.6671.063
siteNYC1673253287061420.3720.4940.7751.268
siteDET0411414201250.2930.4530.7321.185
siteCLE0611314111520.4190.6090.8711.480
siteCHI101139371280.3590.5100.7951.305
siteBOS071249819880.4080.4910.9801.471
stadOpen15154060164137890.3560.4860.7721.258
stadGrass15154060164137890.3560.4860.7721.258
stadDay15154060164137890.3560.4860.7721.258
opponWP of .500+63237257652410.3460.4640.7381.202
opponWP lt .50088303358885480.3630.5030.7991.301
opponOAK197292114130.3190.4300.7221.152
opponMIN228282619160.3900.5050.7801.285
opponDET228382919120.3250.4510.7111.162
opponCLE227091923130.3710.5270.8571.384
opponCHW227361325130.3150.4900.6991.188
opponBOS2287112916130.3910.4850.8391.325
opponBAL22739272190.3700.5110.7951.305
outcbin Wins10738251147105580.3980.5280.8871.415
outcbin Ties1300200.3330.6000.3330.933
outcbin Losses4315591730310.2520.3730.4970.870
platovs LH Starter46155195037330.2970.4320.6841.116
platovs RH Starter10538541114100560.3790.5070.8081.315
stsubas Starter15154060164137890.3560.4860.7721.258
totalTotal15154060164137890.3560.4860.7721.258

Here's Gehrig. I think sitting your rightys might have been the right move against them.

splitsplit_nameGABHRRBIBBSOBAOBPSLGOPS
half1st Half823172910251470.3970.4840.8301.313
half2nd Half73267187358370.3450.4630.6891.152
monthSept/Oct2810762421170.3360.4450.6261.071
monthMay2811283316110.4200.4920.8121.305
monthJune27103133116200.3500.4370.8061.243
monthJuly31116104124180.3880.5000.8101.310
monthAugust269162424120.3520.4870.7361.223
monthApril/March1555422860.4000.4840.8181.303
lineuBatting 4th15558447175109840.3730.4740.7651.240
hmvisHome77277247753440.3470.4550.7221.177
hmvisAway78307239856400.3970.4920.8051.296
siteWAS091139271310.3330.5000.6671.167
siteSTL0711373191140.4050.5420.7841.325
sitePHI111149618450.4900.5281.0201.549
siteNYC1677277247753440.3470.4550.7221.177
siteDET041145314980.4440.5450.8671.412
siteCLE061144194100.2950.3540.4320.786
siteCHI101145211440.3780.4290.8221.251
siteBOS0712486201180.4170.5250.9791.505
stadOpen15558447175109840.3730.4740.7651.240
stadGrass15558447175109840.3730.4740.7651.240
stadDay15558447175109840.3730.4740.7651.240
opponWP of .500+67254227551340.4090.5110.8391.350
opponWP lt .500883302510058500.3450.4450.7091.154
opponOAK2392103213140.4240.5000.8911.391
opponMIN22776222460.4030.5450.8181.363
opponDET228562114140.4000.4900.8001.290
opponCLE227931615190.3040.4210.4680.889
opponCHW2285317990.3180.3830.6471.030
opponBOS2289113714120.4160.4950.9441.439
opponBAL227783020100.3380.4740.7531.227
outcbin Wins1104103914686500.3900.4970.8271.324
outcbin Ties1300110.3330.5000.3330.833
outcbin Losses4417182922330.3330.4150.6261.041
platovs LH Starter47179124024390.3070.3920.5870.979
platovs RH Starter1084053513585450.4020.5080.8441.353
stsubas Starter15558447175109840.3730.4740.7651.240
totalTotal15558447175109840.3730.4740.7651.240

Posted in Site Features, Splits, Uncategorized | 8 Comments »

Splits/Boxes/Gamelog Suggestions

3rd March 2010

I've been working on getting the latest and greatest data from RetroSheet onto the site and will be making a few additions to the affected pages as well, which I'll go into more later when they launch.

Building all of this stuff is a five day process where our server runs continuously for five days building the 120,000 box scores, the 9m rows of play-by-play, the 5m rows of gamelogs, and 10m rows of splits. So adding a little thing here and there just isn't worth it. I've got about two windows a year to get things added and this is one of them. So if you want to suggest a split, gamelog, or boxscore feature, now would be a good time to do so.

One idea I've had since we'll be adding a lot of data from 1920-1939 (no pbp, just boxes) is to add a split for vs. RHstarter and vs. LHstarter. We won't know Lou Gehrig's exact splits, but we'll know what he did when a lefty started the game and when a righty started the game.

Others you would like to see?

Note: We also had a twitter outage after our blog update, but things are back up and running now.

Posted in Box Scores, Gamelogs, History, Site Features, Splits, Stats | 43 Comments »

John Lackey in Fenway Park

14th December 2009

45409100910_Red_Sox_at_AngelsReports suggest that John Lackey is about to sign a contract with the Boston Red Sox.

Much has been made in recent years of Lackey pitching in Fenway Park, where he has by far the worst numbers of his career. Check out his splits by ballpark. These are offensive stats against Lackey:

I Split G PA AB R H 2B 3B HR BB SO SO/BB BA OBP SLG OPS TB BAbip tOPS+
Angel Stadium of Anaheim 112 3101 2819 325 729 140 10 72 223 592 2.65 .259 .319 .392 .711 1105 .303 98
Rangers Ballpark in Arlington 16 394 353 61 105 21 0 13 33 82 2.48 .297 .365 .467 .832 165 .355 131
Turner Field 1 25 23 2 7 1 0 1 1 6 6.00 .304 .360 .478 .838 11 .375 132
Oriole Park at Camden Yards 7 199 187 20 50 10 1 4 10 39 3.90 .267 .307 .396 .702 74 .317 95
Fenway Park 9 240 220 41 69 19 2 8 17 37 2.18 .314 .371 .527 .898 116 .349 148
Comiskey Park II 8 221 202 30 57 8 2 11 14 29 2.07 .282 .330 .505 .835 102 .279 129
Great American Ballpark 1 24 21 3 3 0 0 1 1 4 4.00 .143 .250 .286 .536 6 .125 50
Jacobs Field 6 163 136 17 29 8 0 2 19 27 1.42 .213 .323 .316 .639 43 .248 80
Comerica Park 4 108 93 10 21 7 0 2 14 18 1.29 .226 .333 .366 .699 34 .260 96
Kauffman Stadium 3 87 83 6 25 4 1 1 2 15 7.50 .301 .318 .410 .727 34 .358 102
Dodger Stadium 5 109 97 8 21 4 0 1 6 28 4.67 .216 .290 .289 .578 28 .294 63
Hubert H. Humphrey Metrodome 6 164 151 23 40 5 2 5 8 33 4.13 .265 .313 .424 .737 64 .307 104
Yankee Stadium 8 231 207 23 60 16 0 6 16 40 2.50 .290 .354 .454 .808 94 .333 124
Shea Stadium 1 27 20 3 6 2 0 0 6 6 1.00 .300 .444 .400 .844 8 .400 139
Network Associates Coliseum 15 400 364 32 81 20 0 5 28 71 2.54 .223 .284 .319 .603 116 .262 68
Chase Field 1 28 25 1 5 0 0 0 3 9 3.00 .200 .286 .200 .486 5 .313 39
PNC Park 1 25 24 5 8 0 0 1 0 4 .333 .333 .458 .792 11 .368 118
Safeco Field 14 378 348 39 97 11 1 7 18 71 3.94 .279 .316 .376 .692 131 .327 93
AT&T Park 2 60 57 6 15 5 0 1 2 12 6.00 .263 .300 .404 .704 23 .318 95
Estadio Hiram Bithorn 1 26 25 4 7 0 0 1 1 5 5.00 .280 .308 .400 .708 10 .316 96
Tropicana Field 4 114 106 22 32 4 1 4 7 24 3.43 .302 .342 .472 .814 50 .354 125
SkyDome 8 213 196 19 46 9 1 4 10 43 4.30 .235 .280 .352 .632 69 .278 75
Nationals Park 1 31 29 2 6 0 1 1 2 6 3.00 .207 .258 .379 .637 11 .227 75
Provided by Baseball-Reference.com: View Original Table
Generated 12/14/2009.

Of particular interest is the final column, tOPS+, which basically shows the share of the total offense against Lackey. It shows that, for example, he has pitched very well in Dodger Stadium, Network Associates Coliseum, and SkyDome (isn't that called the Rogers Centre now?) His worst mark is at Fenway Park.

Now, of course, there is one big factor here that we cannot forget. For much of Lackey's career, the Red Sox have been a very good team. More pitchers than not from the last several years have worse numbers against the Red Sox than against most other teams.

The Angels and Red Sox have played each other a few times in the playoffs recently and there was much speculation that the Angels tried to set up their rotation to avoid having to pitch Lackey in Fenway for fear that he would do poorly. How much does that have to do with the ballpark vs. the Red Sox offense? Will it be different for Lackey when he himself wears red socks?

Posted in Splits | 3 Comments »

Using the New PI to Sort Splits

12th November 2009

One of the interesting new features of the PI is the sortable summary provided when using the game finder. This summation provides the total statistics of the games found can be ranked by a variety of different stats. I find this very exciting because it represents the first step in searching splits. Let me explain with an example.

Suppose we wanted to find the player with the most hits on the road in a single season.

  1. Use the Game Finder called Player Batting.
  2. select "Find Players with Most Matching Games in a Season"
  3. Limit your search to Visitor
  4. Search for H>=1

That will provide you with this list:

Rk Player Year #Matching PA AB H 2B 3B HR RBI BB SO BA OBP SLG OPS SH SF IBB HBP GDP
1 Lou Brock 1969 72 Ind. Games 340 319 116 23 7 6 26 18 59 .364 .398 .536 .934 1 1 8 1 2
2 Ichiro Suzuki 2001 70 Ind. Games 348 330 128 17 5 3 35 9 29 .388 .410 .497 .907 2 2 2 5 1
3 Ichiro Suzuki 2004 69 Ind. Games 344 322 145 15 5 4 40 18 23 .450 .480 .565 1.045 0 2 10 2 3
4 Bobby Richardson 1962 68 Ind. Games 345 323 117 22 3 5 33 11 12 .362 .381 .495 .876 9 2 1 0 5
5 Jim Rice 1977 68 Ind. Games 308 282 106 13 7 12 38 22 43 .376 .429 .599 1.028 0 0 2 4 6
6 Don Mattingly 1986 68 Ind. Games 328 303 131 30 2 14 53 21 16 .432 .463 .683 1.147 0 4 6 0 9
7 Felipe Alou 1968 68 Ind. Games 319 294 110 19 3 7 34 22 27 .374 .417 .531 .948 0 2 6 1 7
8 Hank Aaron 1956 68 Ind. Games 299 280 114 19 10 11 51 13 15 .407 .426 .664 1.090 1 5 4 0 9
Provided by Baseball-Reference.com: View Play Index Tool Used
Generated 11/12/2009.

Until now we had to stop at this point and say that "Lou Brock had the most road games with a hit in a season (since 1954)". However, the new version of PI lets us take this a step further. Assuming that it is logical that the player with the most hits on the road in a season would be among the top 300 in games with a hit, we can find that player by sorting for hits. After completing the above search, simply click on the column heading "H" and you will be presented with this list:

Rk Player Year #Matching PA AB H 2B 3B HR RBI BB SO BA OBP SLG OPS SH SF IBB HBP GDP
1 Ichiro Suzuki 2004 69 Ind. Games 344 322 145 15 5 4 40 18 23 .450 .480 .565 1.045 0 2 10 2 3
2 Don Mattingly 1986 68 Ind. Games 328 303 131 30 2 14 53 21 16 .432 .463 .683 1.147 0 4 6 0 9
3 Lance Johnson 1996 67 Ind. Games 316 293 128 19 9 8 38 19 12 .437 .470 .645 1.115 1 2 4 1 2
4 Ichiro Suzuki 2001 70 Ind. Games 348 330 128 17 5 3 35 9 29 .388 .410 .497 .907 2 2 2 5 1
5 Mark Loretta 2004 67 Ind. Games 328 292 126 24 2 5 40 24 17 .432 .466 .579 1.045 0 9 1 3 6
6 Paul Molitor 1991 65 Ind. Games 319 285 124 18 5 10 36 30 22 .435 .492 .639 1.131 0 0 8 2 1
7 Felipe Alou 1966 67 Ind. Games 321 306 123 21 6 12 34 9 29 .402 .425 .627 1.052 1 1 2 4 3
8 Matty Alou 1969 66 Ind. Games 313 299 121 23 6 0 27 12 10 .405 .431 .522 .953 0 0 3 2 2
9 Joe Torre 1971 66 Ind. Games 299 272 121 19 3 15 65 25 30 .445 .493 .702 1.195 1 0 9 1 9
10 Willie Wilson 1980 61 Ind. Games 296 287 120 14 8 1 22 6 26 .418 .434 .533 .967 1 0 0 2 1
Provided by Baseball-Reference.com: View Play Index Tool Used
Generated 11/12/2009.

Brock drops down to #22 and Ichiro now tops the leader board!
Let's do the same thing for hits at home:

Rk Player Year #Matching PA AB H 2B 3B HR RBI BB SO BA OBP SLG OPS SH SF IBB HBP GDP
1 Darin Erstad 2000 70 Ind. Games 328 304 135 21 1 11 57 22 37 .444 .479 .628 1.107 0 2 2 0 3
2 Kirby Puckett 1988 66 Ind. Games 293 279 131 26 5 13 58 11 32 .470 .491 .738 1.230 0 1 3 2 3
3 Wade Boggs 1985 71 Ind. Games 328 281 130 24 2 6 38 43 31 .463 .535 .626 1.162 1 1 2 2 9
4 Ellis Burks 1996 65 Ind. Games 310 275 129 31 6 23 78 29 45 .469 .521 .876 1.397 1 2 2 3 8
5 Dante Bichette 1998 65 Ind. Games 293 279 128 25 2 17 78 12 20 .459 .481 .746 1.227 0 1 2 1 8
6 Jeff Cirillo 2000 67 Ind. Games 317 273 128 36 1 9 74 36 24 .469 .525 .707 1.232 1 5 1 2 7
7 Kirby Puckett 1989 67 Ind. Games 294 278 128 28 2 7 51 12 18 .460 .480 .651 1.131 0 3 5 1 6
8 Eric Young 1996 62 Ind. Games 310 277 127 13 4 7 55 22 10 .458 .506 .610 1.117 0 3 1 8 2
9 Kirby Puckett 1986 64 Ind. Games 297 280 127 21 6 14 49 9 34 .454 .481 .721 1.203 2 0 2 6 3
10 Rod Carew 1977 69 Ind. Games 318 280 126 23 8 8 53 32 23 .450 .502 .675 1.177 1 4 8 1 2
Provided by Baseball-Reference.com: View Play Index Tool Used
Generated 11/12/2009.

Clearly, this technique is limited. It can't be used for stats that usually occur in bunches (most pitching stats). It also can't be used for rate stats like batting average. However, for a lot of hitting stats it can be a fun and useful new tool.

Posted in Game Finders, Leaders, Site Features, Splits, Tutorials | 7 Comments »

Bobby Abreu’s RBI streak

6th November 2009

Bobby Abreu re-signed with the Angels for 2 years yesterday,which surprised me. He had a nice year for a 35-year-old guy and I thought would have wanted to test the open market. Of course, he did that last year after having a good year and had to wait until just before spring training to get signed. Maybe he was happy to jump at a 2-year contract offer.

Anyway, most people know that he's got a long active streak of 100-RBI seasons. Here are the guys with the most 100-RBI seasons in the last 7 years:

                   From  To   Ages Seasons Link to Individual Seasons
+-----------------+----+----+-----+-------+------------------------------+
 Alex Rodriguez    2003 2009 27-33       7 Ind. Seasons
 Albert Pujols     2003 2009 23-29       7 Ind. Seasons
 Bobby Abreu       2003 2009 29-35       7 Ind. Seasons
 Mark Teixeira     2004 2009 24-29       6 Ind. Seasons
 Miguel Cabrera    2004 2009 21-26       6 Ind. Seasons
 Carlos Lee        2003 2009 27-33       6 Ind. Seasons

Only Abreu, A-rod, and Phat Albert have 100-RBI seasons each year.

The PI doesn't yet enable us to search for seasonal streaks, although I am hoping that this is coming down the pike. (I can tell you for sure that many significant additions are in fact coming down the pike, as I have seen the beta of the new version...) I don't know how many players have had 7-season 100-RBI streaks, but it's probably been done a fair amount.

Anyway, the last time Abreu didn't have 100 RBI in a season was 2002, but check out his stats that year. He played in 157 games, had 685 plate appearances, batted .308, slugged .521, and had an OPS+ of 151 (a career best.) And yet, he totaled only 85 RBI. Isn't that crazy? If he got 100 RBI that year, he'd have a streak of 9 such seasons going into next year.

Check out the guys over the last 20 seasons to have at least 600 PAs and an OPS+ of 150 or better but not reach 100 RBI:

  Cnt Player            Year OPS+ RBI  PA Age Tm  Lg  G   AB  R   H  2B 3B HR  BB IBB  SO HBP  SH  SF GDP  SB CS   BA   OBP   SLG   OPS  Positions
+----+-----------------+----+----+---+---+---+---+--+---+---+---+---+--+--+--+---+---+---+---+---+---+---+---+--+-----+-----+-----+-----+---------+
    1 Joe Mauer         2009  177  96 606  26 MIN AL 138 523  94 191 30  1 28  76  14  63   2   0   5  13   4  1  .365  .444  .587 1.031 *2D
    2 Adrian Gonzalez   2009  163  99 681  27 SDP NL 160 552  90 153 27  2 40 119  22 109   5   1   4  23   1  1  .277  .407  .551  .958 *3/D
    3 Todd Helton       2004  165  96 683  30 COL NL 154 547 115 190 49  2 32 127  19  72   3   0   6  12   3  0  .347  .469  .620 1.089 *3
    4 J.D. Drew         2004  157  93 645  28 ATL NL 145 518 118 158 28  8 31 118   2 116   5   1   3   7  12  3  .305  .436  .569 1.005 *9/8D
    5 Bobby Abreu       2002  151  85 685  28 PHI NL 157 572 102 176 50  6 20 104   9 117   3   0   6  11  31 12  .308  .413  .521  .934 *98
    6 Ryan Klesko       2002  152  95 625  31 SDP NL 146 540  90 162 39  1 29  76  11  86   4   1   4   7   6  2  .300  .388  .537  .925 *39/D
    7 Brian Giles       2001  150  95 674  30 PIT NL 160 576 116 178 37  7 37  90  14  67   4   0   4  10  13  6  .309  .404  .590  .994 *78
    8 Edgar Martinez    1999  152  86 608  36 SEA AL 142 502  86 169 35  1 24  97   6  99   6   0   3  12   7  2  .337  .447  .554 1.001 *D/3
    9 John Olerud       1998  163  93 665  29 NYM NL 160 557  91 197 36  4 22  96  11  73   4   1   7  15   2  2  .354  .447  .551  .998 *3
   10 Mo Vaughn         1997  152  96 628  29 BOS AL 141 527  91 166 24  0 35  86  17 154  12   0   3  10   2  2  .315  .420  .560  .980 *3/D
   11 Barry Larkin      1996  154  89 627  32 CIN NL 152 517 117 154 32  4 33  96   3  52   7   0   7  20  36 10  .298  .410  .567  .977 *6
   12 Bobby Bonilla     1995  151  99 614  32 TOT ML 141 554  96 182 37  8 28  54  10  79   2   0   4  22   0  5  .329  .388  .576  .964 5973
   13 Andy Van Slyke    1992  151  89 685  31 PIT NL 154 614 103 199 45 12 14  58   4  99   4   0   9   9  12  3  .324  .381  .505  .886 *8
   14 John Kruk         1992  150  70 607  31 PHI NL 144 507  86 164 30  4 10  92   8  88   1   0   7  11   3  5  .323  .423  .458  .881 *39/7
   15 Will Clark        1992  150  73 601  28 SFG NL 144 513  69 154 40  1 16  73  23  82   4   0  11   5  12  7  .300  .384  .476  .860 *3
   16 Rafael Palmeiro   1991  155  88 714  26 TEX AL 159 631 115 203 49  3 26  68  10  72   6   2   7  17   4  3  .322  .389  .532  .921 *3/D
   17 George Brett      1990  153  87 607  37 KCR AL 142 544  82 179 45  7 14  56  14  63   0   0   7  18   9  2  .329  .387  .515  .902 *3D/975
   18 Fred McGriff      1990  153  88 658  26 TOR AL 153 557  91 167 21  1 35  94  12 108   2   1   4   7   5  3  .300  .400  .530  .930 *3/D
   19 Eddie Murray      1990  158  95 645  34 LAD NL 155 558  96 184 22  3 26  82  21  64   1   0   4  19   8  5  .330  .414  .520  .934 *3

Most of these guys either had fewer PAs than Abreu's 685 or got a lot closer to 100 RBI.

So why did Abreu fall short of 100 RBI in 2002? The Phillies were an average team that year with a record of 80-81. Abreu batted 3rd almost the entire season except for a stretch where he hit 4th. It would seem that he was in good position to drive in 100 runs.

It seems to me that the key is the guys who were hitting in front of him. Jimmy Rollins hit 1st or 2nd almost the entire year but managed only a .306 OBP, a pathetic value for a leadoff guy and Rollins' worst until this year's abysmal .296 OBP. The guy hitting second was often Doug Glanville, he of the .292 OBP that season.

Check out Abreu's splits for the last 9 seasons batting with runners on base:

I Year G PA AB H 2B 3B HR RBI BA OBP SLG OPS
2001 155 321 251 70 22 0 13 92 .279 .408 .522 .930
2002 145 313 251 81 22 2 7 72 .323 .438 .510 .948
2003 149 325 261 94 19 0 11 92 .360 .465 .559 1.024
2004 145 326 255 85 23 1 13 88 .333 .457 .584 1.041
2005 152 359 285 87 15 0 14 92 .305 .426 .505 .931
2006 145 343 265 94 23 1 13 105 .355 .472 .596 1.068
2007 148 363 313 86 21 4 6 91 .275 .355 .425 .780
2008 144 330 290 92 24 1 13 93 .317 .397 .541 .938
2009 139 332 269 91 19 0 5 93 .338 .437 .465 .901
Career Total 1782 3986 3232 1049 240 19 126 1057 .325 .433 .528 .960
Provided by Baseball-Reference.com: View Original Table
Generated 11/5/2009.


Yeah, it looks like Rollins and Glanville not getting on base too much was the difference. In 2002 Abreu had an average number of games with runners on base (145) but the fewest total plate appearances (313). He also had a low total of homers with runners on base (7) despite having an average year in total number of homers (20, not visible in the chart above.) This was a contributing cause to his low RBI total.

In the 8 years above other than 2002, Abreu averaged 93 RBI while hitting with runners on, getting the rest of his RBI each season on solo homers. In 2002, though, he got just 72 RBI with runners on despite having BA, OBP, and SLG just about smack dab on his averages for his entire career in that situation. Had he gotton just his average 93, he would have been over 100 RBI for the year.

Posted in Season Finders, Splits | 19 Comments »

David Ortiz – the final look

23rd October 2009

I wrote a lot about David Ortiz this year and now it's time to check in on his final numbers for the season.

Check out his 2009 splits by month:

Split G PA AB R H 2B 3B HR RBI BB SO BA OBP SLG OPS TB
April/March 22 100 87 10 20 7 1 0 12 8 22 .230 .290 .333 .623 29
May 24 108 91 6 13 6 0 1 6 15 26 .143 .278 .242 .520 22
June 24 88 75 13 24 4 0 7 18 12 18 .320 .409 .653 1.062 49
July 25 98 89 13 22 5 0 7 24 7 22 .247 .306 .539 .845 48
August 26 115 99 20 22 6 0 7 18 16 20 .222 .330 .495 .825 49
Sept/Oct 29 118 100 15 28 7 0 6 21 16 26 .280 .381 .530 .911 53
Provided by Baseball-Reference.com: View Original Table
Generated 10/22/2009.


After dismal months in April and May he was great from June on. In fact, in his last 101 games of 2009 (June 6 onwards) Ortiz had 27 HR and 78 RBI, with a SLG of .557 and an OPS of .917. His career averages are .545/.922 so he's really right there in terms of hitting his averages.

The big question for 2010 is whether he'll be the Ortiz of old with just the expected slight decline with age or whether he'll be the guy who produced a lot less during most of 2008 and early 2009.

Posted in Splits | Comments Off on David Ortiz – the final look