Run scoring per game (plus: Red Sox Valley)
Posted by Andy on May 24, 2010
Here is a histogram of the run-scoring per game so far in 2010, broken down by league.
A few things to note:
- As you can see, so far the American League has scored 3 or 4 runs in a higher fraction of its games. By comparison, the National League has scored 0, 1, 2, or 5 runs more frequently.
- The American League has a strange step-plot, which I'm sure is coincidental. So far they have scored 3 and 4 runs almost identically, as well as 5 and 6 runs, and 7 and 8 runs, and 9 and 10 runs.
- The National League has played nearly 100 more games so far this season (since they have more teams.) This alone may explain why their distribution is a little bit broader. I would assume that these two distributions would get closer to each other as the season progresses.
While I was putting together this plot I decided to graph the Red Sox's team scoring. Here it is, against just the AL plot:
If you recall, a little while ago I noted how the Red Sox tended to score a bunch of runs or very fun runs. This graph really shows that with the huge dip at 4 and 5 runs. They are outpacing the rest of the AL in 6-, 7-, 8, and 9-run games, but also in 2- and 3-run games.
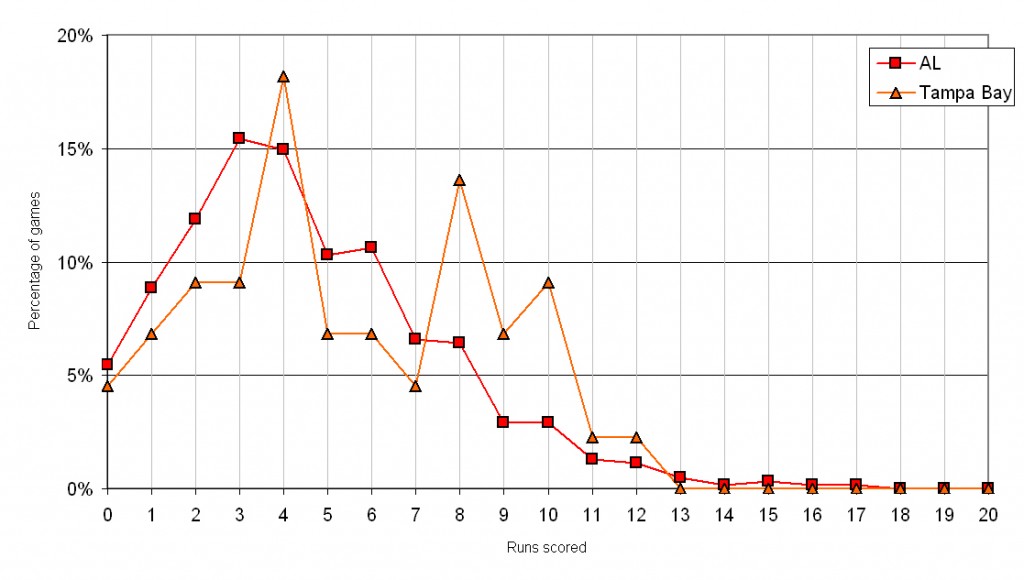
Here's the same plot for the Rays:
Interesting, huh? They have excelled at scoring 4 runs, but also 8-12 runs. They are way under the league average in 0-3 runs and 5-7 runs. With great pitching like theirs, 4 runs is going to be enough to win most of the time.


May 24th, 2010 at 2:25 pm
This is kind of related: I just noticed that Jason Kendall now has the same number of career hits as Mike Piazza. Kind of ironic, since Piazza is the most powerful slugging catcher of all time, and Kendall is... almost the opposite.
Fascinating stuff about the runs per game by team.