Scoring by inning: AL vs NL (PART 1)
Posted by Andy on November 4, 2007
Reader MikeC asked about scoring by inning in the two leagues, and whether it was different, so I did a quick analysis.
First, here is the scoring by inning, broken down by league, for 2007:
inning     AL              NL              AL                NL
-------------------------------------------------------------------
1          1323            1598            12.08%            13.35%
2          1195            1162            10.91%             9.71%
3          1320            1350            12.06%            11.28%
4          1258            1373            11.49%            11.47%
5          1314            1463            12.00%            12.22%
7          1166            1353            10.65%            11.30%
8          1213            1321            11.08%            11.04%
9           766             874             7.00%             7.30%
-------------------------------------------------------------------
totals    10949           11969           100.00%           100.00%
After the innings column, the next two columns are the raw number of runs scored in each league by the AL and the NL (incidentally, I got these numbers from the league-wide splits pages for the AL and NL.) Runs scored in extra innings are ignored in this analysis. The last two columns are the percentage of runs scored by each league in each inning. (It's just the runs scored for that inning in that league, divided by the total number of runs scored by that league.) Remember there are 16 NL teams and 14 AL teams.
The first thing I noticed was that, indeed, the NL scores a lower fraction of its runs in the 3rd inning as compared to the AL. This is because the pitcher bats most often in the 3rd inning in the NL. Sometimes, the pitcher bats as early as the 2nd inning (if the team scored a run or two in the 1st or 2nd) and once in a great while he bats as early as the 1st inning (if the team scored at least 3 runs with the bases loaded and two outs) and once in a while the pitcher doesn't bat in the 3rd because he gets lifted for a pinch-hitter. But all of those are fairly rare occurrences and most often the pitcher does bat in the 3rd, and he's a weak batter.)
But then you notice that the NL scores a higher fraction of its runs in the 1st inning, and a lower fraction in the 2nd inning. Both of these disparities are quite larger than the 3rd-inning disparity. I suspect that the 2nd-inning disparity can also be explained by the presence of the pitcher. If a team scores 3+ runs over the first 2 innings plus gets a few more baserunners, the pitcher will bat in the second inning, usually with runners on. There must be a great disparity between leagues, having a (usually at least somewhat) capable 9th-hole hitter in the AL trying to bat those runs in as compared to the pitcher in the NL.
However I am at a bit of a loss to explain the increased scoring in the 1st inning in the NL. I don't believe there is any evidence that the 1-, 2, and 3-hitters are better in the NL (and if so, that's an imbalance that wouldn't last.) The only theory I can come up with is that it is a style of play issue, that the NL pushes across runs in the first more often (perhaps using bunts and advancing groundouts more often.) I am going to look into this in a future column, probably tomorrow's. (After a bit more analysis, I found the answer: in reality virtually the exact same number of runs are scored in the AL and NL in the first inning. It's just that the NL scores significantly fewer runs in innings 2-9 than in the NL, making their first-inning performance a larger fraction. More on this in Part 2.)
But for now, let's just stick to the actual scoring-by-inning data.
You also notice that scoring is way down in the 9th. The biggest factor here is that, of course, the home team does not bat in the 9th when it wins games (I'm ignoring wins in the 9th inning here.) That would account for, on average, something like a 27% dropoff in run-scoring in the 9th, since home teams play half the games (50%) and win about 54% of the time, and 50% of 54% is 27%. In reality, scoring in the 9th inning as compared the average of innings 1 through 8 is is down 37% in the AL and 34% in the NL. There are two other causes that I think account for this gap. Once is the presence, oftentimes, of the closer, who is simply a better pitcher than most and limits the scoring. The other is that in a tie game in the 9th, the home team can score only so many runs. Obviously, it cannot score more than 4 (a walk-off grand slam) and scoring is often limited to one run on a walk-off single-RBI base hit.
Finally, I wanted to graph the data for scoring by innings. To make sure that 2007 wasn't a fluke, I went back and found all the data for years 2002 through 2006 as well, and take my word for it that each year is very similar. The NL always scores more in the 1st (on a percentage basis), much less in the 2nd, and a little less in the 3rd.
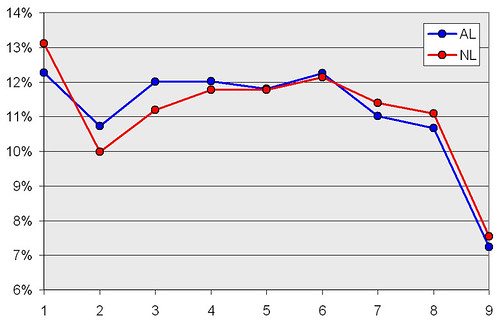
So we have innings on the x-axis and percentage of runs scored on the y-axis. AL is blue and NL is red. This graph is average performance over the 5 year period of 2002 to 2007.
Don't read too much into this data yet, as my spoiler about Part 2 tells you that viewing this by percentages can be misleading.
In Part 2, we'll look at raw numbers of scoring by inning in each league. This will show that scoring is essentially identical in the first inning, with larger disparities in the 2nd and 3rd. We'll also take a look at some scoring histograms for at least the 2nd or 3rd inning, to see exactly how the scoring is different between leagues.
November 5th, 2007 at 7:56 am
[...] OK, here is part two of yesterday’s post. [...]