One-inning non-save-situation relief appearances
Posted by Andy on January 11, 2010
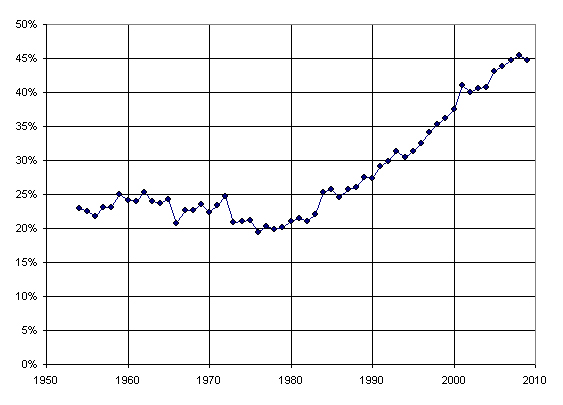
Recently I contended that 1-inning relief appearances (not counting save situations) were more common now than ever. Here is the data to back up this claim.
I did a few simple PI searches and then tabulated the results in Excel. I searched for all 1-inning relief appearances, subtracted out all 1-inning save situation appearances, and divided that by all relief appearances minus all save situation appearances. Therefore, that gives us the fraction of all non-save situation relief appearances that last exactly 1 inning. Mind you, this does not mean that the appearances occurred all in the same inning, such as the 7th or 8th inning. They could just as easily be from 2 outs in the 7th to 2 outs in the 8th, for example.

Again, this is fraction of non-save-situation relief appearances that lasted exactly one inning. I find the results very surprising. It's not so much that it has increased, but the degree to and consistency with which it has increased. Since 1986, the fraction of non-save-situation relief appearances that lasted one inning has gone up every single season except for four. Over that time period, the percentage has increased by 0.96 points on average per season, meaning just about 1 full percentage point each year. True, the rate has slowed over the last half dozen years or so (one would hope) but the overall trend is incredible.
In short, we've nearly reached the point where half of all non-save-situation relief appearances last exactly one inning after having many years where the fraction was less than 1 out of every 4. Simply amazing.
Johnny Twisto suggested that Cito Gaston and the 1992-1993 Blue Jays may have been ahead of the curve in these 1-inning appearances. He was right. In 1992, the Blue Jays were at 50.2% of their non-save-situation relief appearances lasting 1 inning. The rest of baseball was only around 29%. In 1993, the Blue Jays dropped back a bit to 41.5% but were still ahead of the rest of the league, which was around 30%.
I wonder just how much further this is going to increase. On the one hand it seems like it can't go that much further as the game is simply not predictable enough to have the duration of pitchers' appearances so tightly-controlled. On the other hand, more teams are adopting more rigid practices around relievers, with most teams now having a dedicated 8th inning guy and many having even a dedicated 7th inning guy.
This will be an interesting one to track going forward.

January 11th, 2010 at 11:36 am
Does your definition of save situation includes holds? Many of the "dedicated 7th/8th inning guys" enter the game in a save situation, they just eventually get pulled for the closer.
January 11th, 2010 at 11:54 am
Good point David. I wonder exactly what search parameters he used.
It would also be interesting to see a chart including saves, or another one only showing length of saves.
I like these graphs which reveal how much the game is really changing, even though the differences year-by-year are so small one might not notice if one is oblivious to the numbers.
January 11th, 2010 at 11:59 am
I used the 'save opportunity' bubble on the PI search page. Not sure what that includes--I'll have to research it.
January 11th, 2010 at 1:10 pm
I just did a quick search and it looks like "Save Opportunities" does NOT include holds, but it DOES include all blown saves, which would include leads blown in the 7th inning when the pitcher in question was not going to get a save but only a hold. So it's saves and blown saves, regardless when they occur.
January 11th, 2010 at 1:55 pm
There is probably just as much of an increase in less than 1 inning releif appearances with the emergence of the lefty specialists and righty/lefty match-ups by managers.
January 11th, 2010 at 1:59 pm
I had a similar thought and will look at that too.
January 11th, 2010 at 8:15 pm
This one might also be interesting to split up by league. Notice the big (and lasting) dip beginning in 1973, the year of the DH.
January 12th, 2010 at 7:56 am
[...] You Are Here > Baseball-Reference.com > Blog > Baseball Stats and Analysis B-R Blog & Stat of the Day Numbers, News, and Notes « One-inning non-save-situation relief appearances [...]
January 18th, 2010 at 12:01 am
[...] from about 25 percent in 1984 to about 45 percent in 2009. Andy chronicles this trend at the Baseball-Reference blog. Late-inning specialization surely has something to do with the shifting numbers, with multi-inning [...]