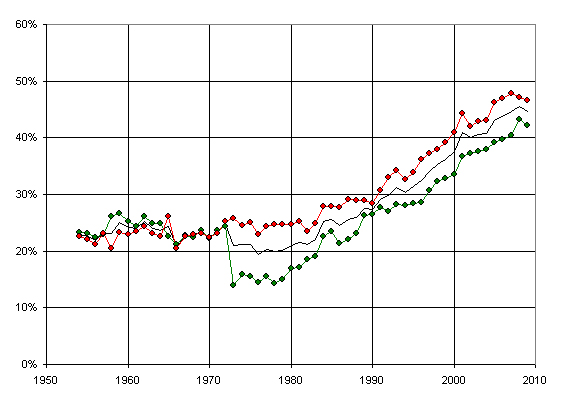
One-inning relief appearances by league
Posted by Andy on January 12, 2010
Reader eorns suggested breaking down yesterday's graph by league, and the results are interesting (just as he or she suspected.)
Yesterday we looked at relief appearances (other than those in save situations) that lasted exactly one inning.
Here is the same plot broken down by league:

The red line is for the NL while the green line is for the AL. The black line is the average, which is what I posted yesterday.
So, yes, just as eorns noted, something dramatic happened in 1973 when the DH came into existence. The data in the NL stayed pretty constant from 1954 through 1983 but the AL data took a major plunge starting in 1973. I have to assume that this is due to a sudden shift in how pitchers were used, namely that guys who were used for exactly one inning prior to 1973 were sometimes lifted when the DH came up to bat starting that year.
Note that the drop was quite significant, going from 24.3% of all AL non-save-situation relief appearances in 1972 to 13.9% in 1973. That's close to a halving, which is quite a big change in the usage model.
The NL shows absolutely no change above the baseline level of variation in 1973. Both leagues show a jump up in 1984 and another in 2001. One league or the other has had other jumps up and down over the years. One wonders if the jump up in the AL from 1992 to 1993 was the influence of the rest of the league seeing how Cito Gaston was using his Blue Jays bullpen.
I find it surprising that the difference between the league persists today the way it does, but this may still be down to the DH. I suppose a reliever is more likely to stay in the game to finish out an inning if the pitcher hits for himself or maybe if even a pinch-hitter comes in. Since most DHs are better hitters than the average pinch-hitter, their presence may be what separates the leagues in this behavior.

January 12th, 2010 at 11:03 am
Very cool plot.
January 12th, 2010 at 2:34 pm
I like this chart kick you've been on lately. Sometimes a simple graph can say more than a detailed table.
Here's a challenge for you: can you think of any stat that when plotted like this from 1954 to 2010 would produce a flat line? I.e. is there any aspect of the game that has stayed constant throughout the last 60 years? Of course, exactly flat would be impossible so what about with, say 5% variation from the average?
A quick scan of common hitting and pitching stats shows that innings/game has remained pretty much the same with an average of about 8.95 IP/G. The farthest outlier is the 9.05 average in 1957 - must've been a lot of extra inning games that year. Of course, this isn't terribly interesting or telling since there's not much you could do to the game that would result in more or less extra inning games or wins at home. I wonder if there's another simple stat that's remained constant that's more interesting.
January 12th, 2010 at 4:45 pm
I wonder if there's any correlation between this and the frequency of relief appearances less than 1 inning. Certainly I would guess that managers today are more likely to send in a one-out lefty specialist. Would that data show a similar split between leagues?
January 12th, 2010 at 5:02 pm
[...] Andy has been discussing "one-inning" relievers this week, I thought that it might be interesting to take a look at another [...]
January 13th, 2010 at 1:35 am
I find these very interesting. Did anyone know that exactly 1-inning relief appearances have been increasing at such a steady rate, or that the AL has consistently had about 5 percentage points fewer, even as both rise? Probably not.
January 13th, 2010 at 1:42 pm
Regarding the current difference between leagues, I suppose there are enough times when a pitcher who is due up next inning is kept in the game so as not to "waste" another reliever, who would not be able to start the next inning since he'd be lost to a pinch hitter.
As for the dramatic drop, I'd bet that starting in 1973, AL teams kept relievers in *longer* than 1 inning since their spot no longer came up in the order. Relievers regularly went several innings back then. In the mid-80's, as the overall length of relievers' stints decreased, the AL caught up to the NL in the exactly 1-inning department.
January 20th, 2010 at 10:26 am
[...] take a look at relief pitchers brought in to face just one batter. Unlike my recent series of posts dealing with duration of relief appearances, the data in this post considers [...]