The (continually) dying art of the complete game
Posted by Andy on December 27, 2008
It shall come as no surprise to anyone that the Complete Game is a dying art. That's not news. But I thought I'd graph a couple of the sets of numbers to show just how rare it's becoming.
Firstly, here are the fraction of starts in MLB games that resulted in complete games.

(click on the graph for a larger version)
Basically, complete games have been in decline for as long as we have detailed data, except for a small renaissance in the late 60s through mid 70s. Whereas it was routine back then to see more than 1 out of every 4 starts result in a complete game (meaning that, on average, 1 out of every 2 games featured a CG by either of the starters,) the average has now fallen below 3% yearly, a decrease of a factor of 10 from 50 years earlier.
Here's another way of looking at it, one that allows us to look waaaaay back. Checking out the progressive complete game leaders page allows us to see what the leading career total was among active pitchers each season. Here's a graph of that data.
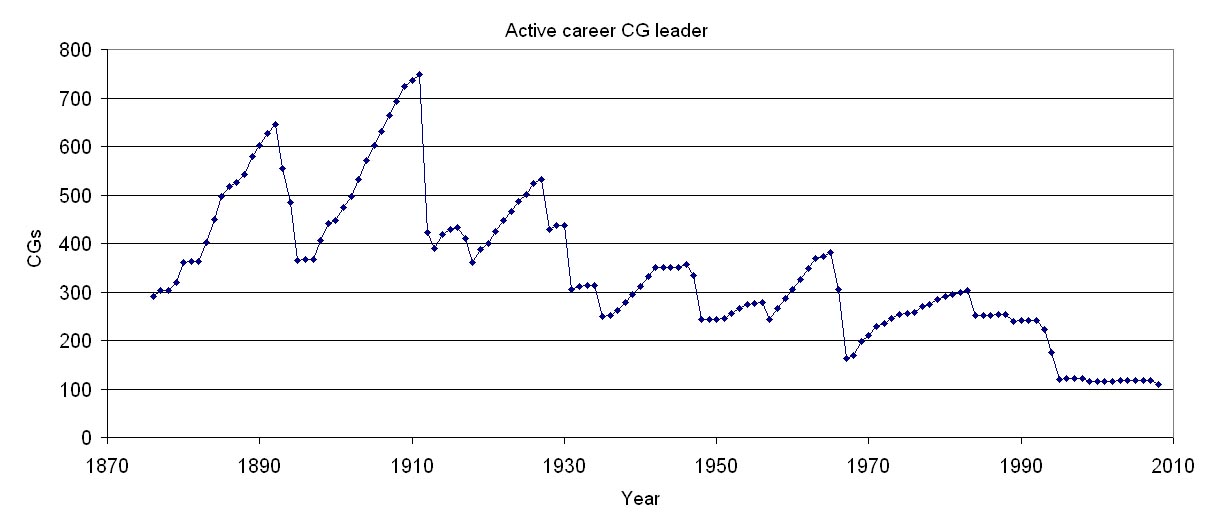
Here we see that prior to 1950, it was common for the active career CG leader to have at least 300 career complete games. Not so anymore. When Greg Maddux retired a few weeks ago, he was the career leader with 109 CGs. Now it's Randy Johnson with just 100. The next 3 guys after Johnson are all effectively retired already: Curt Schilling (83), Mike Mussina (57), and Tom Glavine (56.) Two more guys who also might not pitch anymore come next: John Smoltz (53) and Pedro Martinez (46.) That means that when RJ retires, the career leader will almost certainly have fewer than 100 career CGs.
Incidentally, the big drop-offs on the above graph occurred when the far-and-away active leader retired, such as Pud Galvin in 1892, Cy Young in 1911, Walter Johnson in 1927, Burleigh Grimes in 1934, Robin Roberts in 1966, etc.
I also researched complete game losses. It's generally more similar, but such games were more common in the 1970s than in the late 50s and 60s. In the late 1950's, about 5-5.5% of starts resulted in complete game losses. That number fell to 3% in the 1960s before peaking at 7% in 1974. Since then, it has gradually dropped, to 5% in 1979, then 4% in 1983, then 3% in 1989, then 2% in 1994, and falling below 1% in 2003. This past year, just 30 starts, or 6/10ths of 1% were complete game losses.
December 29th, 2008 at 2:06 pm
It's nice to see a graphical representation of the deterioration of a big part of the game. Those of us who have been around a while have seen it. You can trace the real decline to the specialization of pitching, especially the closer, who became a "position player" in the 1970s.
Now, pitching is specialized to the point that there are guys who only pitch the middle innings, others who set-up the closer and a smaller class of "long relievers" who come in when the starter fails early.
In today's game, managers don't allow pitchers to pitch out of trouble. They have so many relief pitchers (earning giant salaries) that they yank the starter either at the magical 100-pitch mark (there's another research topic for you - number of pitches per game per starter) or when he gets to the sixth inning and puts a couple of runners on, regardless of the size of the lead.
100 pitches has become some sort of "perfect" pitch count, as though the human arm knows what a round number is. Why not 120 pitches or 136? Who came up with this horrible game-ruining habit?
February 25th, 2009 at 12:47 pm
[...] published a piece a couple of months ago, that might catch your interest, called, “The (continually) Dying Art of the Complete Game”. It is an [...]